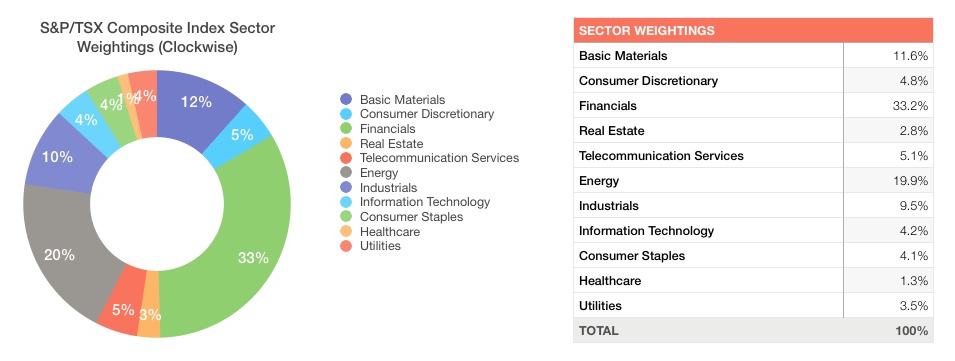
Investors would likely expect their portfolios to beat the S&P/TSX Composite Index’s measly advance this year, but this is unlikely to be the case if they are disproportionately underweight the two largest sectors that are in the black — namely, industrials and energy.
Taking a look at the chart below, we can see the weightings of every sector that constitutes the composite. In order to beat or to lag the index, a portfolio must either weight the sectors differently than the composite, or weight specific stocks in any given sector differently than they are weighted, by market capitalization, in the composite. In a typical portfolio, both scenarios described are likely to take place.

This article will examine the cyclical, sensitive, and defensive sector groupings with an eye toward the performance and weight of their constituents in the index. Further, we will examine how understanding the composition of the index can permit only a few investments to provide similar returns to the entire benchmark.

Cyclical sectors
While financials make up just over 33% of the index as a whole, they represent over 60% of the cyclical sectors. Materials are more than 20% of the cyclicals, and consumer discretionary and real estate account for just under 10% and around 5%, respectively.
Consumer discretionary and real estate are the outperformers of the group, but they hardly move the needle on the index, as they have such small weightings. Conversely, a glance at the graph above will make it immediately obvious how closely the index tracks the performance of the heavily weighted financials.

A portfolio holding only Royal Bank of Canada (TSX:RY)(NYSE:RY) and Nutrien (TSX:NTR)(NYSE:NTR) in the cyclical group would yield a high level of correlation to their respective indices, as can be seen above. Overweighting the consumer discretionary or real estate sectors would significantly alter the performance of a portfolio, as the two sectors account for only 7% of the composite combined.

Sensitive sectors
Of the sensitive sectors, energy accounts for over 50% of the group and about 20% of the entire index. The remaining sensitives are composed of industrials at 25%, telecoms at 13%, and technology at 11%.
All but telecoms have outperformed the composite this year; however, only energy and industrials have sufficiently significant weightings in the index to see their moves reflected in the big picture.

As an example, the chart above shows how an investor could replicate the performance of the energy and industrial sectors and thus the sensitive sectors, broadly speaking, with two investments. Simply holding Canadian Pacific Railway (TSX:CP)(NYSE:CP) and Canadian Natural Resources (TSX:CNQ)(NYSE:CNQ) would provide a satisfactory mirroring of the sensitives.

Defensive sectors
Turning to the defensive sectors, consumer staples is the most influential sector, accounting for approximately 45% of the defensives and about 4% of the composite. Utilities are a close second, making up almost 40% of the defensives, and health care is the smallest player at only around 15%.
All of the defensive sectors are in the red this year, consumer staples being the least punished of the sectors with a loss of less than 1%. It is important to keep in mind that all of the defensive sectors combined make up for less than 10% of the index and thus exert little influence on the movement of the composite.

Taking a look at the chart above, we can see that Loblaw Companies (TSX:L) and Fortis (TSX:FTS)(NYSE:FTS) track their respective sectors well enough to be representative investments in the pursuit of matching the index; health care accounts for only slightly more than 1% of the index and can easily be left out without creating a significant tracking error.
Conclusion
Many investors gauge the performance of their portfolios in relation to the benchmark. Sector weightings represent one of the most significant areas where portfolios can become skewed away from tracking the index.
By understanding the structure of the composite, investors who wish to mirror its performance can do so with only a few stocks. Likewise, those who wish to get a clearer picture of what sectors are distorting their relative returns can do so by exploring the way in which the index is weighted.


