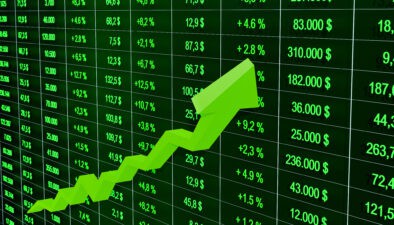
It’s been a weird few months. Faced with a global pandemic, the TSX Index had its sharpest and quickest decline in history. Since it bottomed on March 23, the index is up 28%. In other words, the entire national stock market is trading like a penny stock.
Any market rally larger than 20% is technically considered a “bull market.” The previous bull market, the longest in history, went on for nearly a decade.
Will the current one be similarly sustainable? Probably not. Here’s why.
Underlying sectors
The flagship index is created as a mirror image of the Canadian economy, which means the underlying constituents represent Canada’s key sectors. At the moment, the S&P TSX Composite Index is dominated by financials, energy and industrials.
Financials such as banks, asset managers and insurance companies collective account for a third (32%) of the TSX. This sector now faces a sudden spike in delinquencies from businesses and consumers. Asset managers face losses from small businesses in their portfolio going bankrupt. Lenders, meanwhile, face a housing market crash.
Energy, of course, faces steeper challenges. The price of crude oil slid below $0 last week. While the oil price has rebounded into positive territory, Canada’s tar sands face logistical and pricing issues that go beyond geopolitics. It’s a mess and accounts for 13.2% of the TSX.
Finally, industrial production and demand has stalled. Factories are shut, borders are closed so even finished non-essential goods can’t be exported. This capital-intensive, highly leveraged sector accounts for 11.9% of the TSX.
More than half the index faces a grim future.
The road ahead
Canada’s government health experts are warning the nation could face a second wave of the pandemic in 2020, suggesting that social distancing could be the norm until we reach either herd immunity or develop a vaccine. In other words, the Canadian economy faces a prolonged slowdown.
Canada’s economy hinges on demand for housing, the price of oil, exports and immigration. All of those factors face major hurdles over the rest of the year. The economic recovery could be “U-” shaped or even “L-shaped” depending on how long this slump lasts.
TSX index valuation
While the underlying economy faces a “U-” or “L-shaped” recovery, the TSX index has already had a “V-shaped” bounceback. February 23 to March 23, the TSX index lost 36% of its value. Between March 23 and April 23, the market has regained 28%. The V-shape couldn’t be more symmetrical.
Based on the famous Buffett indicator, the market is fairly valued now. The stock market’s total capitalization is 103% of the nation’s gross domestic product (GDP), which would imply an 8.1% compounded annual return.
However, it’s important to note that the Buffett indicator is based on reported GDP. GDP figures reported in the final quarter of 2019 have nothing to do with the pandemic-infused GDP of 2020. Experts have warned that Canada’s GDP could fall anywhere from 3.5% to 6.2% in the year ahead.
As the GDP is nearly certain to fall, I would argue that the Buffett indicator is overvalued looking ahead.
Foolish takeaway
The TSX Index market rally is overdone. At best, the market is fairly valued. At worse, there’s plenty of pain ahead for investors.
 Act Fast: 75 Only!


