Shopify (TSX:SHOP)(NYSE:SHOP) stock rose to its glory in the pandemic. During the lockdown, many retailers closed their physical stores temporarily. Almost all retailers, even grocers, move their stores online. Shopify saw Black Friday-level traffic on its website in April, which doubled its second-quarter revenue. It didn’t see such high growth since 2016. This revenue growth reflected in its stock price that almost tripled from $500 on April 1 to over $1,480 on September 1.
Investors and Wall Street analysts both became bullish on Shopify stock and priced it for 10 years.
Shopify stock is overvalued
Shopify stock is now overvalued. Its high price has made it very volatile and limited its upside. The stock is particularly volatile ahead of its third-quarter earnings on October 29.
Investors already have inflated expectations, and this reflects in the stock’s valuation. Investors price high-growth stocks on their revenue growth. A 78 times price-to-sales ratio suggests that investors expect Shopify’s revenue to surge 900% in the next few years. To achieve this growth, it at least has to show another 100% revenue growth in the third quarter. If it reports anything short of 100%, its stock could see a double-digit dip even if the revenue growth is impressive. That is the price you pay for inflated expectations.

Shopify stock’s technical pattern
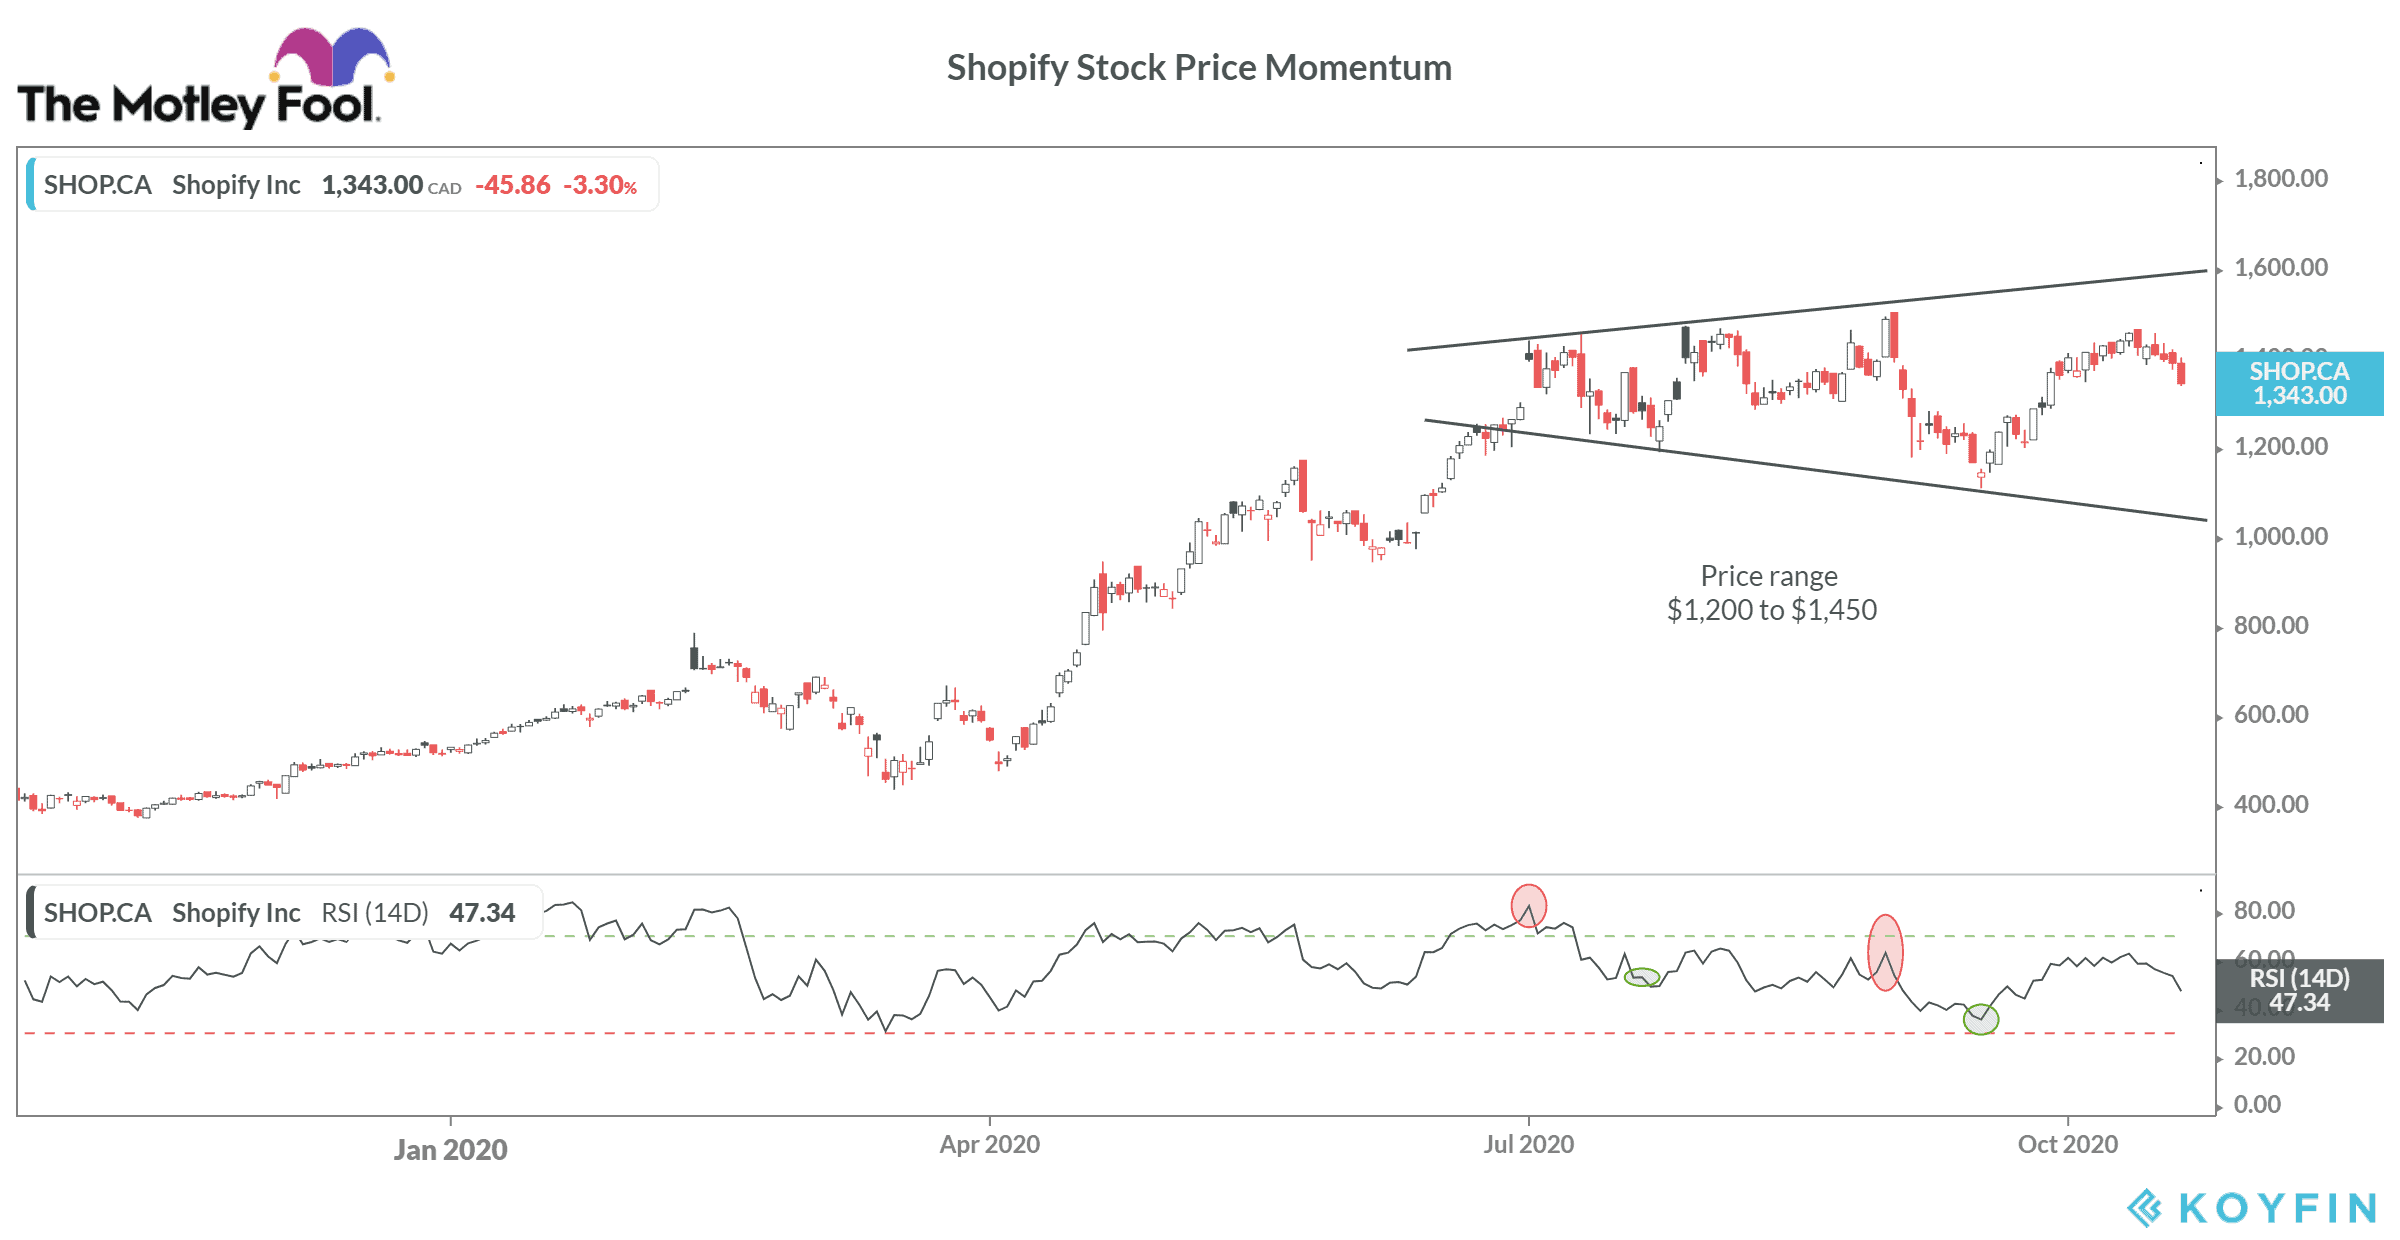
Despite the strong fundamentals, Shopify stock is hanging on to a cliff. It has both bullish and bearish investors. In the above chart, you will see a megaphone pattern is forming where the stock price is moving at two extremes, either near $1,200 or near $1,450. This pattern forms when the stock has made two peaks and two troughs, as in the case of Shopify.
It is also called a broadening formation where the two lines move in the opposite direction. This happens because investors are split. Some bulls say the decline in Shopify stock is just a correction. They are willing to buy the stock over hopes it will rise in the long-term. Some bears say that Shopify stock has reached its peak. They are willing to sell as they don’t see any upside.
Generally, this pattern forms after the stock rallied or declined significantly and before an event like earnings or a product launch. Remember, technical patterns only show short-term stock price momentum. Long-term investors generally lose money in a broadening formation as it signifies volatility. There is a way you can make money from Shopify’s volatility in the short-term. But it comes with risks.
How to make money from Shopify’s stock price volatility
Shopify stock’s price range ($1,200-$1,450) represents a 20% upside and a 17% downside. The stock may trade slightly above or below this range, but you can’t time the peak and the trough. The trick is to buy into the downtrend and sell into the uptrend. The two peaks and troughs the stock made in the last three and a half months included this price range.
Moreover, Shopify’s trough had more sellers — a Relative Strength Index closer to 30-40 — and peaks had more buyers (RSI of 60-80). RSI shows in which direction the trading activity is skewed.
At present, Shopify stock is trading at $1,341 with an RSI of 47, which indicates people are selling ahead of earnings. Buy the stock when it falls to around $1,200 or $1,250 with an RSI of 40. You can easily buy at this price as there would be more sellers than buyers. Then wait and sell the stock when it approaches $1,450. Don’t wait for the stock to rise further as it may or may not.
Investor takeaway
Shopify has long-term growth potential, but its current trading price makes it an expensive buy. A safer way to get exposure to the stock’s growth is through the iShares S&P/TSX Capped Information Technology Index ETF, which has 26% of its holdings in the e-commerce giant.


