The FANG (or FANGMA) stocks are responsible for delivering most of the outstanding returns posted by both the S&P 500 and NASDAQ 100 indexes over the last decade. Comprised of Meta (Facebook), Amazon, Netflix, Google (Alphabet), Microsoft, and Apple, the FANGMA has become synonymous with U.S. large-cap tech growth.
These tech stocks are expensive, though. To buy one share of each company at their current price, an investor would need $7,373.23. Oh, and that’s in U.S. dollars, too, so you’ll have to pay the currency conversion costs of exchanging your Canadian dollars over to buy them.
However, various exchange-traded funds (ETFs) can offer you instant, capital-efficient, and cheap exposure to the FANGMA cohort. Today, I’ll be profiling just one: Evolve FANGMA Index ETF (TSX:TECH).
How does it work?
As an ETF, TECH holds an underlying “basket” of stocks — in this case, the six FANGMA stocks. When you buy a share of TECH, you’re therefore buying the underlying FANGMA stocks. How much of the FANGMA stocks you will own depends on the number of TECH shares you buy and their percentage allocation within TECH.
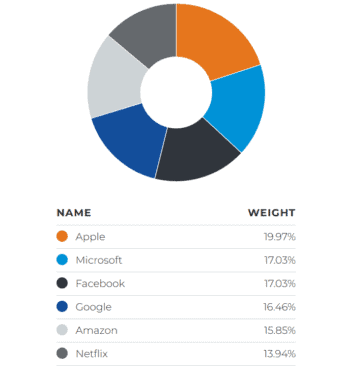
As of right now, TECH has the six FANGMA stocks held in the following proportions:

TECH currently has a management expense of 0.40%, which is expensive compared to index funds but typical for a thematic fund. The management expense ratio (MER) is yet unknown, as trading, tax, and turnover costs haven’t been determined yet.
The ETF is relatively new, so assets under management (AUM) is low at just $57 million, and volume isn’t too high. However, liquidity and bid-ask spreads shouldn’t a problem, as the underlying six FANGMA stocks are heavily traded.
TECH is also hedged to using forex derivatives. Theoretically, this means that TECH’s value will not be affected by fluctuations between Canadian and U.S. dollars. In practice, the nature of the currency futures contracts used and the imperfect way they are rolled forwards doesn’t always guarantee this.
How does it perform?
When it comes the performance of TECH, we want to assess its tracking error — that is, how much its returns differ from holding the six underlying FANGMA stocks in the exact same proportions, with less being better
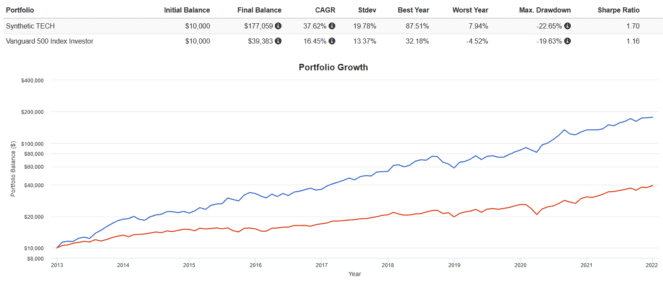
We can’t see how TECH has performed, as the fund has less than one year of data. However, we can approximate by backtesting how a portfolio of the six underlying FANGMA stocks would have performed if they were held according to the same weightings in TECH and rebalanced annually:

It looks pretty good! We see massive outperformance compared to the S&P 500. I expect the actual returns of TECH to be similar, minus a percentage or so to account for the MER and currency hedging costs.
The Foolish takeaway
For investors with a smaller account or unwilling to convert Canadian dollars to U.S. dollars, an ETF like TECH could be an easy, capital-efficient, and cheap way of gaining exposure to the FANGMA stocks.
However, keep in mind that past performance does not equate to future performance. Investing in only large-cap U.S. tech growth is a poor strategy that really only works based on hindsight. There’s no easy way to know the winners of tomorrow, so the best strategy is diversifying.


