Welcome to a series where I break down and compare some of the most popular exchange-traded funds (ETFs) available to Canadian investors! In this article, we’ll be going global with our picks.
Canadian investors looking to diversify their portfolios outside the Canadian stock market should consider buying pre-made ETF portfolios from Vanguard and BlackRock. These all-in-one ETFs hold thousands of stocks from U.S., international developed, and international emerging markets.
Up for consideration today are Vanguard FTSE Global All Cap ex Canada Index ETF (TSX:VXC) and iShares Core MSCI All Country World ex Canada Index ETF (TSX:XAW).
Image source: Getty Images
VXC vs. XAW: Fees
The fee charged by an ETF is expressed as the management expense ratio (MER). This is the percentage that is deducted from the ETF’s net asset value (NAV) over time, calculated on an annual basis. For example, an MER of 0.50% means that for every $10,000 invested, the ETF charges a fee of $50 annually.
VXC has an MER of 0.21% compared to XAW at 0.22%. The difference is miniscule (a difference of $1 on a $10,000 portfolio), but if we absolutely had to pick a winner, it would be VXC by a tiny margin.
VXC vs. XAW: Size
The size of an ETF is very important. Funds with small assets under management (AUM) may have poor liquidity, low trading volume, high bid-ask spreads, and more risk of being delisted due to lack of interest.
VXC currently has AUM of $1.32 billion, whereas XAW has AUM of $1.88 billion. Although both are sufficient for a buy-and-hold investor, XAW is the more popular one, but just slightly.
VXC vs. XAW: Holdings
Both ETFs here are considered “funds of funds” in that their underlying holdings are not stocks but rather other ETFs. This makes sense, as XAW and VXC are intended to be all-in-one portfolios that exclude the Canadian market.
XAW chooses to allocate approximately 62% to the North American market, 27% to the international developed markets, and 11% to the international emerging markets.
VXC chooses to allocate approximately 60% to the North American market, 28% to the international developed markets, and 12% to the international emerging markets.
VXC vs. XAW: Historical performance
Both funds are quite new, so their performance history is rather limited. Nonetheless, a backtest is useful for assessing their tracking error and relative performance.
A cautionary statement before we dive in: past performance is no guarantee of future results, which can and will vary. The portfolio returns presented below are hypothetical and backtested. The returns do not reflect trading costs, transaction fees, or taxes, which can cause drag.
Here are the trailing returns from 2016 to present:
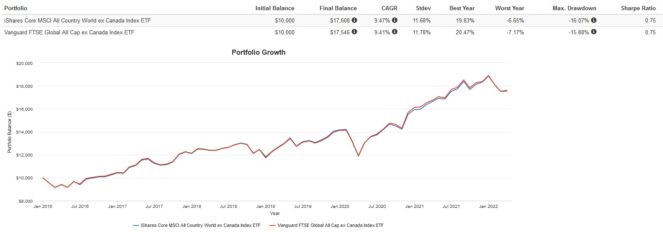
Here are the annual returns from 2016 to present:
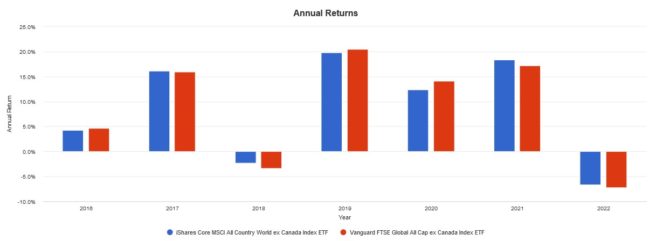
Both ETFs have virtually identical performance given their similar MER and underlying holdings. While there may be differences in annual returns due to fund turnover and re-balancing, over the long run, I expect both ETFs to be neck and neck.
The Foolish takeaway
If I had to pick and choose one ETF to buy and hold, it would be VXC due to the 0.01% lower MER and Vanguard’s history of lowering fees. Both funds have roughly the same holdings with good diversification. Still, if you’re partial to BlackRock, XAW is a fantastic choice as well.