Welcome to a series where I break down and compare some of the most popular exchange-traded funds (ETFs) available to Canadian investors!
Canadian investors taking a passive approach to buying dividend-growth stocks can pick their own, but an easier and more hands-off approach is through using an ETF. Both BlackRock and BMO Global Asset Management provide a set of low-cost, high-liquidity ETFs that offer exposure to a portfolio of great dividend stocks.
The two tickers up for consideration today are iShares Canadian Select Dividend Index ETF (TSX:XDV) and BMO Canadian Dividend ETF (TSX:ZDV). Which one is the better option? Keep reading to find out.
XDV vs. ZDV: Fees
The fee charged by an ETF is expressed as the management expense ratio (MER). This is the percentage that is deducted from the ETF’s net asset value (NAV) over time, calculated on an annual basis. For example, an MER of 0.50% means that for every $10,000 invested, the ETF charges a fee of $50 annually.
XDV has an MER of 0.55% compared to ZDV at 0.39%, which is a difference of $16 per year for a $10,000 portfolio. The winner here is clear: ZDV is the far cheaper ETF. Over time, buying a lower fee ETF will save you significantly in terms of opportunity cost.
XDV vs. ZDV: Size
The size of an ETF is very important. Funds with small assets under management (AUM) may have poor liquidity, low trading volume, high bid-ask spreads, and more risk of being delisted due to lack of interest.
XDV currently has AUM of $1.91 billion, whereas ZDV has AUM of $904 million. While both are more than sufficient for a buy-and-hold investor, XDV is clearly the more popular one. I expect both ETFs to grow more over time, as investors learn about them, but for now, XDV wins here.
XDV vs. ZDV: Holdings
XDV tracks the Dow Jones Canada Select Dividend Index, which holds a total of 30 stocks. The majority of the ETF is concentrated in the financials (55.17%), telecommunications (12.05%), and utilities (11.11%) sectors. The current distribution yield is 3.91%.
ZDV is semi-actively managed as opposed to tracking an index and holds a total of 50 stocks. The majority of the ETF is concentrated in the financials (37.20%), energy (15.28%), telecommunications (12.03%), and utilities (12.60%) sectors. The current distribution yield is 3.86%.
It is important to note that XDV is passively managed. The stocks it holds are based on whatever the index it tracks decides to include. In contrast, ZDV’s fund managers use a semi-active methodology and screener to pick stocks based on three-year dividend-growth rate, yield, payout ratio, and liquidity.
XDV vs. ZDV: Historical performance
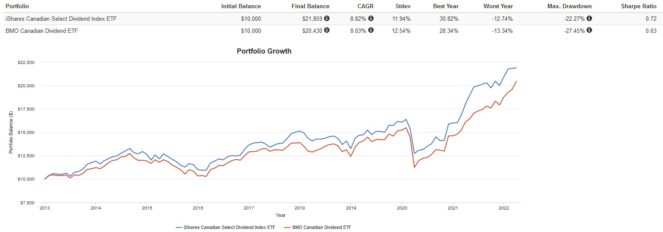
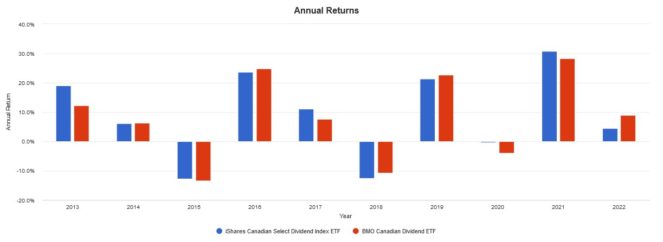
A cautionary statement before we dive in: past performance is no guarantee of future results, which can and will vary. The portfolio returns presented below are hypothetical and backtested. The returns do not reflect trading costs, transaction fees, or taxes, which can cause drag.
Here are the trailing returns from 2013 to present:

Here are the annual returns from 2013 to present:

XDV outperformed ZDV over the last few years. I attribute this to XDV’s higher concentration of Big Six bank stocks, which posted amazing earnings, revenues, and dividend increases in the last decade. Still, sectors are cyclical, and ZDV has been outperforming so far in 2022 thanks to its higher concentration of energy stocks, which XDV lacks.
The Foolish takeaway
If I had to pick and choose one ETF to buy and hold, it would be ZDV. Although I am not a fan of semi-active management, the much lower MER and the lower concentration in financial stocks makes it better suited for a long-term holding, in my opinion. That being said, if you’re bullish on the Big Six bank stocks, XDV could be a great addition to your portfolio as well.


