Most investors (including me) will find it very difficult to beat the market consistently. While some investors can get lucky and outperform it in the short term, many will fail over the long run. Even fund managers and stock pickers often underperform a simple index fund over time. The market is efficient, and the various stock market indexes out there are notoriously difficult to beat in the long run.
The S&P 500 Index
The most famous index, and the benchmark many professional investors measure themselves against is the S&P 500. The S&P 500 tracks the largest 500 companies listed on U.S. exchanges and is widely seen as a barometre for overall U.S. stock market performance. It makes for a great passive investment.
If you’re able to convert USD to CAD cheaply and are investing in your Registered Retirement Savings Plan (RRSP), you can save significantly by using a U.S.-denominated S&P 500 exchange-traded fund (ETF) like iShares Core S&P 500 Index ETF (NYSE:IVV).
IVV is as cheap as it gets for ETFs, costing just 0.03% per year in management expense ratios (MER). That’s around $3 per year for a $10,000 investment, making IVV a perfect low-cost vehicle for tracking a well-known, high-performing index.
The total U.S. stock market
That being said, the U.S. stock market doesn’t end at just the S&P 500. Beyond the index, there are another +3,000 mid-, small-, and micro-cap stocks out there worth investing in. These stocks often have different risk/reward profiles, and their volatility can help boost long-term returns.
By market capitalization, the S&P 500 accounts for around 82% of the U.S. stock market’s weight. That means there’s another 18% of stocks out there unaccounted for. To track these stocks for max diversification, investors can turn to the S&P Total US Stock Market Index.
In this case, consider buying iShares Core S&P Total US Stock Market ETF (NYSE:ITOT). Compared to IVV, ITOT holds 3,150 more mid-, small-, and micro-cap stocks. Roughly 82% of ITOT is IVV, making their performance and composition somewhat similar. Surprisingly, ITOT is just as inexpensive as IVV is, costing just 0.03% in MER.
Head to head
Over very long periods of time, ITOT can be expected to perform very similarly to IVV, but with higher volatility. Because 82% of ITOT is IVV, its performance is still highly correlated to the S&P 500. The remaining 12% of mid- and small-cap stocks adds some volatility, which can boost returns but also increases risk.
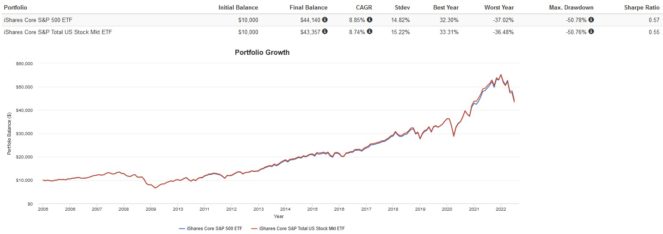
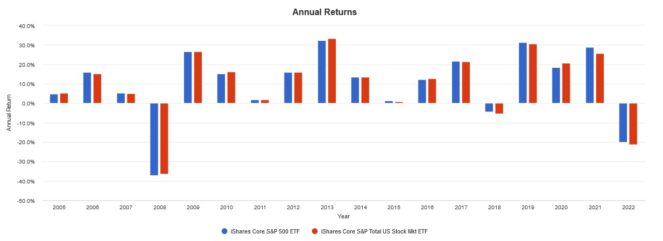
I’ve backtested the returns of the S&P 500 vs. the total U.S. stock market from 2004 below. A cautionary statement before we dive in: past performance is no guarantee of future results, which can and will vary. The portfolio returns presented below are hypothetical and backtested. The returns do not reflect trading costs, transaction fees, or taxes.
Trailing returns are virtually identical, with ITOT having slightly more volatility but also higher returns.

Annual returns are similar too, with ITOT outperforming some years, and IVV in others. I attribute this to the cyclical nature of small- and large-cap stocks, which take turns outperforming.

At the end of the day, both ETFs had identical risk-adjusted performance, max drawdowns, and a 0.99 correlation. It’s honestly a coin flip here.
The Foolish takeaway
My pick here is ITOT. We don’t know whether small or large caps will do better in the future. The evidence suggests that both are cyclical. Large caps did particularly well in the last decade, but small caps outperformed in the years following the dot-com bubble.
While the S&P 500 is a solid investment, investors seeking a truly passive approach should buy the total U.S. stock market. This is all the more compelling when you consider that IVV and ITOT cost the same MER. A great way to use both is as tax-loss harvesting pairs.


