The idea is simple: you pick dividend-paying stocks, and these stocks pay you regularly. Reinvest these payments back into buying more shares, and the cycle of growth spirals upward. And if you’re picking stocks that not only pay dividends but also grow them consistently, you’re on the fast track.
Now, if you’re wondering how this strategy pans out over time, we need to crunch some historical numbers. How long does it actually take for a $20,000 investment in stable TSX dividend stocks to grow to $100,000 through the power of compounding dividends? Let’s do the math.
Setting some guidelines
Before we dive into projections and backtesting, we need to address the elephant in the room: survivorship bias. It would be far too convenient – and misleading – to handpick dividend stocks that have shone in the last decade. That’s not how the real-world of investing works.
Ideally, to get a realistic sense of potential growth, we’d look at a Canadian dividend ETF with a solid track record spanning a couple of decades. Unfortunately, such an ETF with the requisite history just isn’t available yet.
In lieu of this, we’re turning to the iShares S&P/TSX 60 Index ETF (XIU) as a stand-in. It’s not exclusively a dividend fund, but with a robust yield of around 3% as of today, it’s a fair representation of what a Canadian blue-chip dividend approach might yield.
Plus, we have access to data dating back to the year 2000, which gives us a substantial timeline for our analysis that’s less sensitive to recent events.
The results
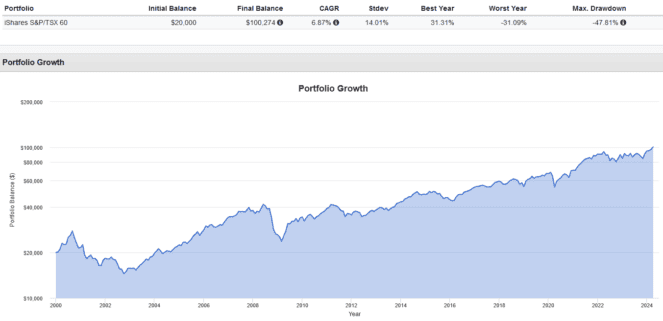
If you had invested $20,000 in XIU back in the year 2000 and reinvested all the quarterly dividends diligently, your investment would have grown to $100,274 by 2024.

This would equate to a compounded annual growth rate (CAGR) of 6.9%. While this figure may not be as dramatic as some high-flying tech stocks, it represents stable and consistent growth over the years.
The standard deviation (Stdev), a measure of volatility, was 14%, indicating that the investment had a moderate level of risk. The best year saw a return of 31.3%, showcasing the potential for significant upside in good market years.
However, it wasn’t without its rough patches: the worst year saw a decline of -31.1%, and the investment experienced a maximum drawdown, or peak-to-trough loss, of -47.8% during particularly turbulent market periods like the 2008 financial crisis.
The takeaway? This backtest scenario underscores the power of dividend reinvestment and potential for steady, long-term growth by investing in a diversified basket of Canadian blue-chip stocks.
It’s a testament to the adage that “time in the market beats timing the market,” with two decades of disciplined investing and reinvestment leading to a fivefold increase in the initial capital.


